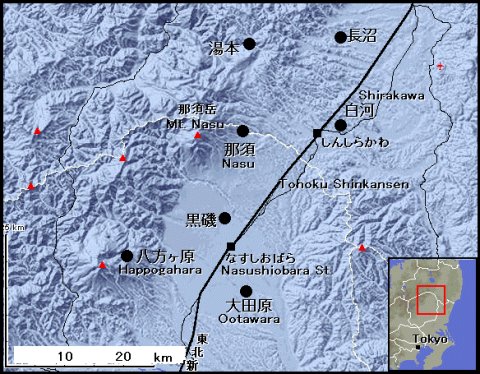
Fig.1 Distribution of rainfall observation station of Japan Meteorological Agency around Shirakawa city
�� is the position of rainfall observation station and station name
MapFan II(C)Increment P Corp.
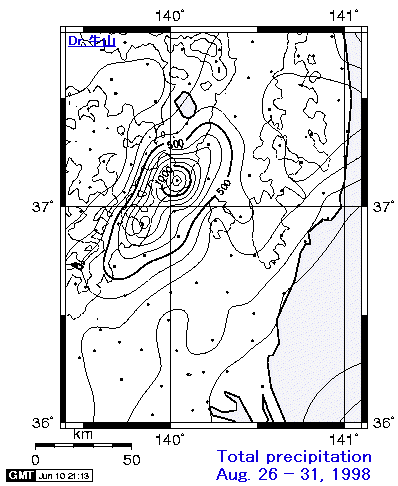
Fig.2 Distribution of total precipitation from August 26th to August 31th
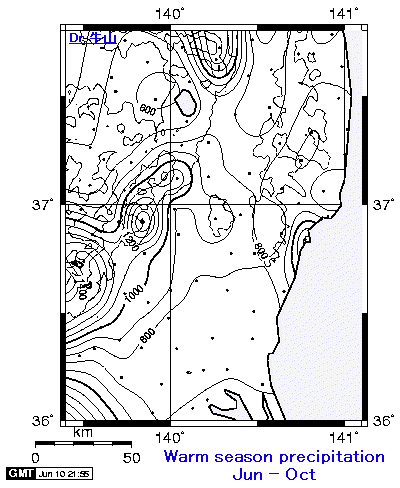
Fig.3 Distribution of mean monthly precipitation on August
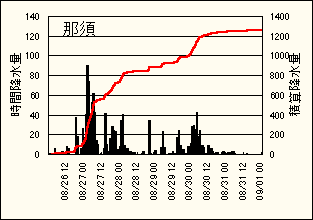
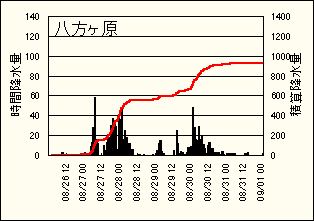
Fig.4 Temporal variations in Nasu and Happogahara (Aug. 26, 1998 to Aug. 31)
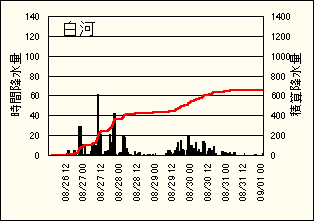
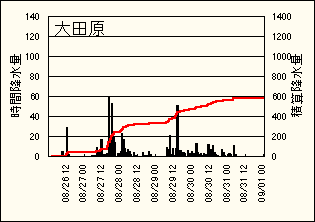
Fig.5 Temporal variations in Shirakawa and Ootawara (Aug. 26, 1998 to Aug. 31)
Table 3 Extremes of daily precipitation and continuous precipitation in Shirakawa (1951-1998)
| Ranking | Date | Daily precipitation (mm) |
Date | Continuous precipitation (mm) |
|
| 1 | 61/06/27 | 177.5 | 77/08/21 | 289.0 | |
| 2 | 58/09/26 | 175.7 | 64/09/02 | 287.2 | |
| 3 | 71/08/31 | 162.0 | 61/06.30 | 286.3 | |
| 4 | 61/09/10 | 151.2 | 64/09/01 | 283.7 | |
| 5 | 66/06/28 | 150.8 | 77/08/20 | 283.5 | |
| 6 | 91/09/19 | 150.0 | 71/09/12 | 278.5 | |
| 7 | 82/09/12 | 145.0 | 64/08/31 | 275.4 | |
| 8 | 86/08/04 | 125.0 | 64/08/30 | 273.2 | |
| 9 | 71/09/06 | 124.0 | 58/07/28 | 272.5 | |
| 10 | 58/07/22 | 118.7 | 64/08/29 | 271.5 | |
| 98/08/27 | 267.0 | 361.0 | |||
| 98/08/28 | 65.0 | 429.0 | |||
| 98/08/29 | 114.0 | 533.0 | |||
| 98/08/30 | 102.0 | 644.0 | |||
| 98/08/31 | 11.0 | 656.0 |